LinkedIn Analytics, or how to break the algorithm?
Have you ever wondered how to manage a project successfully? Have you ever wondered how to find out what appeals to your audience, which campaign or initiative should be re-organised, and which idea may have had some thought and potential but was not successful in its implementation? Well, imagine LinkedIn Analytics as the magic key to understanding it all - from your online influence, to how the algorithm in your platform distributes. With this social media feature, you can find out what's drawing people's attention to your profile, what posts are spreading better, and how to turn your audience into active followers. LinkedIn - this is where people and businesses are trying to differentiate themselves in an already oversaturated market. The platform isn't just for sharing photos, food or vacations, like various social media platforms like Facebook and Instagram. This is where professional connections are built and business is developed.
LinkedIn Analytics - How to access it?
We've already mentioned why it's important to regularly look at LinkedIn's data analytics option. But where can we find these analytics? Different profiles on the platform suggest different placement of this option. More than once or twice, the LinkedIn team has optimized the location of the analytics button - from below the main profile information itself (About You), to the top part in the user profile.
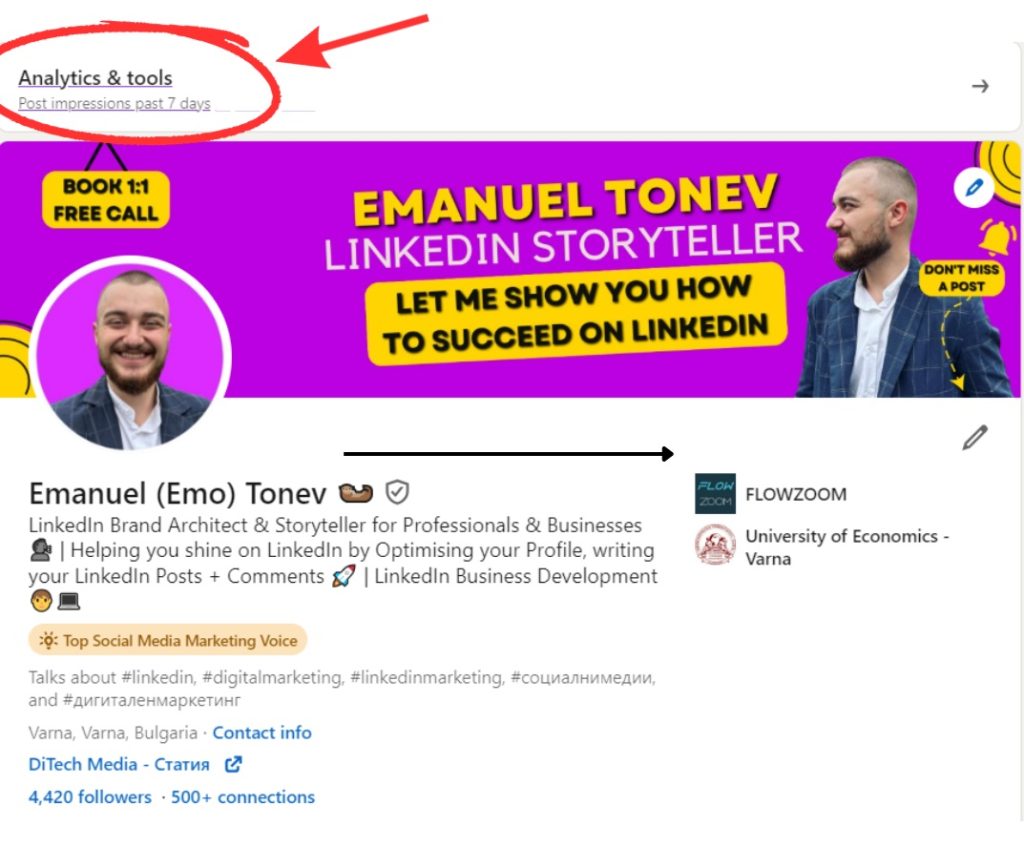
After opening the analysis functions, a window will appear on your screen where you can find more information about:
-
- Post Impressions - shows how many people have seen your posts in a certain period of time. It's important to mention that this is not the unique number of people who have seen your posts, as a single post can reach the same person more than once.
-
- Followers - shows the total number of followers you have at that time, as well as the percentage change in how many people have followed you over a certain period of time.
-
- Profile Viewers - shows how many people have logged in to view your profile in the last 90 days. With a paid LinkedIn profile, you have a chance to see all the people who have viewed your profile up to 365 days ago.
-
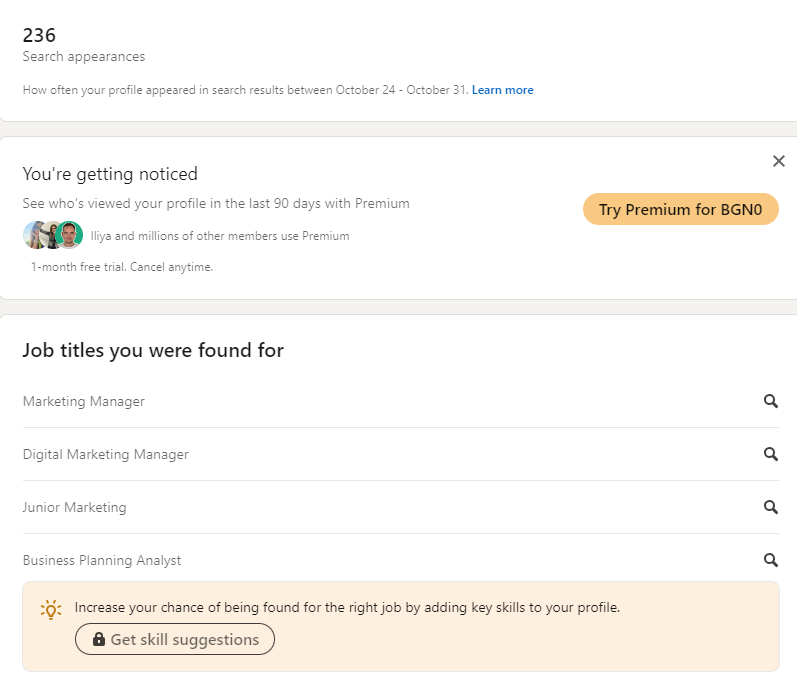
- Search Appearance - shows how many times you have appeared in various social media searches in the last 7 days. If you have a paid LinkedIn profile, you have a chance to see information about recent
In order to better understand each of the different functionalities that the platform offers, we will go through them in detail, explaining how we can take advantage of the information that is provided to us.
Post Impressions
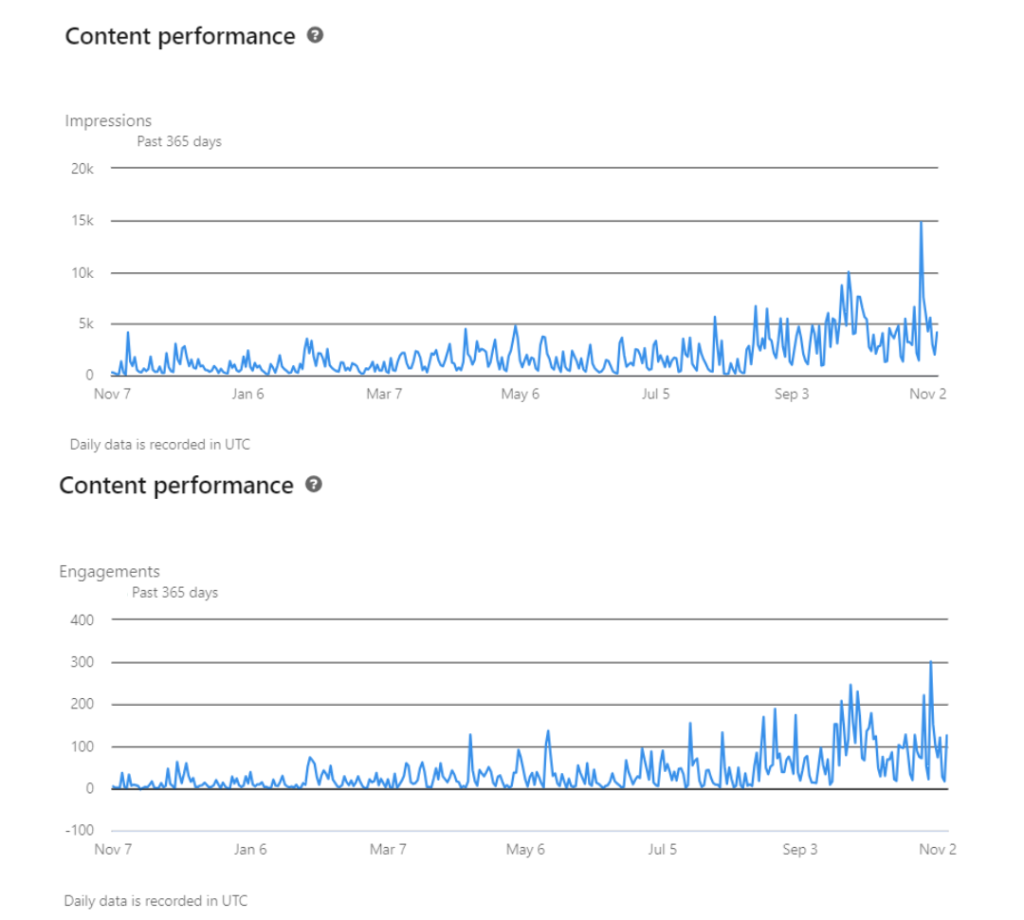
A number of people identify this functionality as one of the most important in the entire Analytics section, because here, no matter what the profile is, you can monitor how the posts are performing in terms of impressions and engagement в 5 different periods of 7, 14, 28, 90 and 365 days.
Through this feature, trends can be tracked for the different campaigns an account is undertaking. The graphs also show the summed number of impressions and engagement for a particular day, also comparing the data in relation to the previous day.
The last option of the part "Post Impressions" lists the best performing publications (Top performing posts) that a person has shared for their chosen time period. In this way, it can be visually tracked which posts gather more views and consequently more interest, which can then be repeated or continued in case they are part of a certain section.
Followers
The option for checking followers on one hand is identical to that for checking impressions. Here again one can follow the development of the number of followers in the periods - 7, 14, 28, 90 and 365 days. The benefit of this information is that again, the trends in the profile should be tracked, the key here is to compare on which day, what type of post led to an increase in the number of followers. If a trend emerges, then that post type can be duplicated.
Example: marketer creates 2 types of content:
-
- 1 regular post per week on the topic "social media"
-
- Test publication with an analysis of a company's performance in the business environment
The rubric may be of more value according to the content creator, but garner far fewer impressions, engagement and followers. On the other hand, a test post can be very successful, and if a gradation in profile metrics is detected, the post type (an analysis of a company's performance in the business environment) should be repeated
Another option, part of the "Followers" field is "Top demographics". This reveals demographic information about the people who follow you (including followers with and without connections). The information revealed in this section is:
-
- Job Titles
-
- Locations
-
- Industries
-
- Seniority
-
- Company Size
-
- Companies
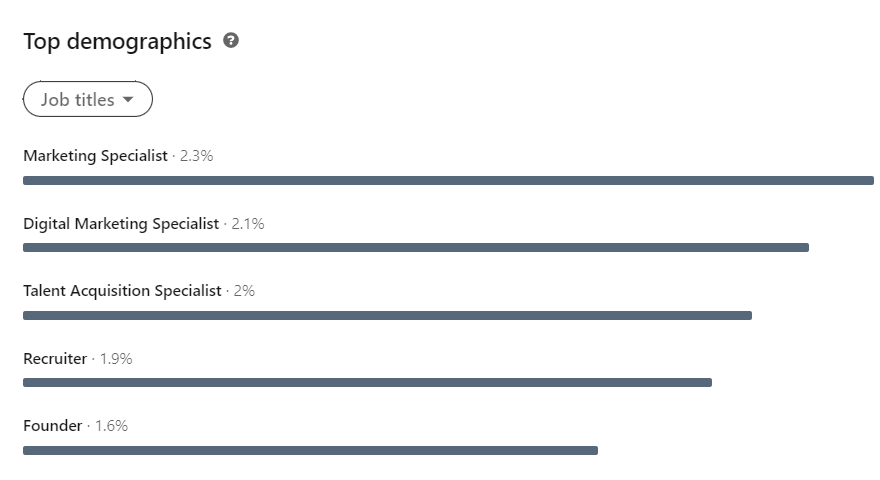
Depending the information that is listed here you can make a direct reference of your strategy. If your target audience of the data that LinkedIn visualizes, then a rethinking of the overall strategy should be done of a creative and technical nature.
Profile Viewers/Visits to your profile
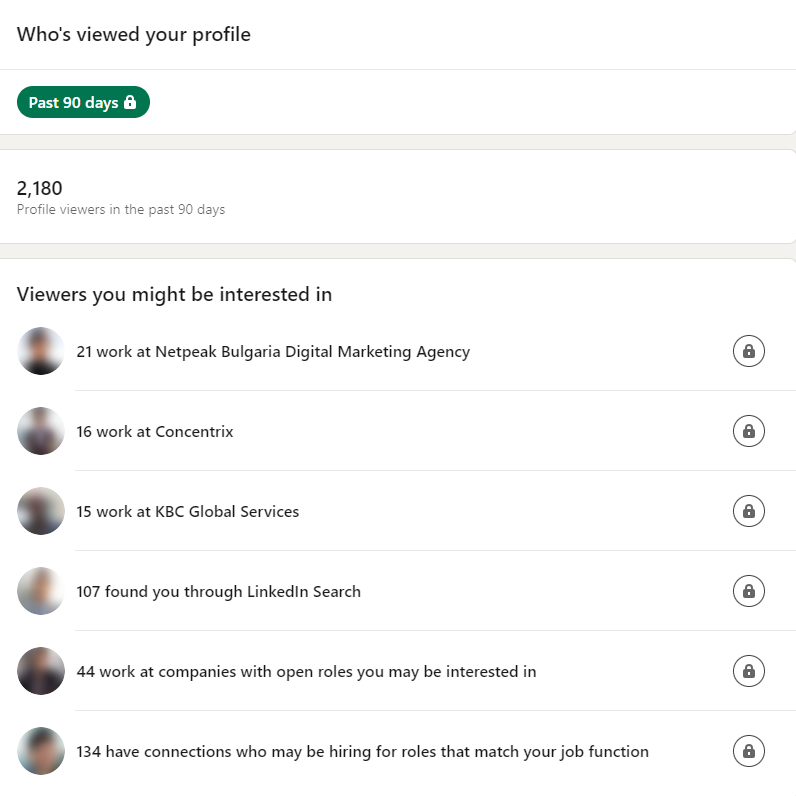
This part of your profile analytics reveals who has viewed your profile in the last 90/365 days. As mentioned above, depending on the type of profile, the information you have available differs - free profiles have information for the last 90 days and paid profiles have information for the last 1 year.
The rubric may be of more value according to the content creator, but garner far fewer impressions, engagement and followers. On the other hand, a test post can be very successful, and if a gradation in profile metrics is detected, the post type (an analysis of a company's performance in the business environment) should be repeated
The information you have available here is often summarized as follows:
-
- People who work in certain companies
-
- People who work in a particular sector
-
- People who have found you organically
-
- People who might be looking for employees who fit your profile
From this information you can sift out potential companies that have an interest in you. The information here can also help you find out if anyone from the company in question has run a background check on you if you have applied for a job.
Search Appearance
Last but not least is the option for "search appearance". It shows how many people have viewed your profile in the last 7 days, and if your profile is paid, you have 90 days of information. The information you have available is which job positions you have shown up for most often, which companies all the people who found you work for. Here again you can see which people have viewed your profile and from which companies, as well as the main job positions of the users who have searched for you.
Here you can see how your profile performs in resonance with your creative strategy. You can extract information about whether what you're doing is successful and whether it's bringing you more traffic from the right people.
In summary, LinkedIn data analysis is a powerful tool for any professional looking to improve their presence on this social media platform. With the help of detailed statistics and analytics, you can build more effective strategies for communicating, recruiting and staffing, or developing your network of contacts. Monitor the results of your analytics regularly and adapt your activities accordingly to achieve greater success in the virtual world of business and professional growth.
Source: DiTech Media
